Currently Empty: EGP0.00
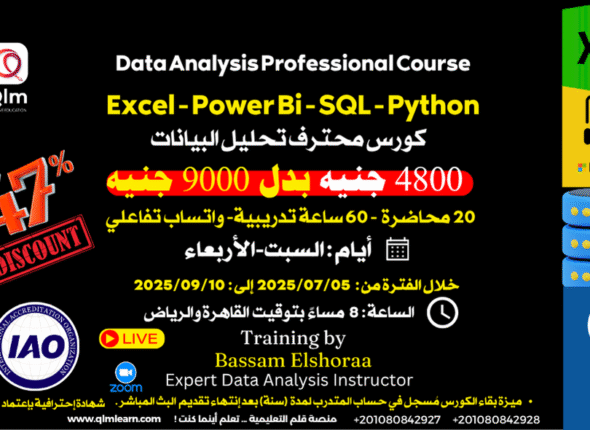
Bassam Elshoraa
1 دورة • 2 الطلابسيرة شخصية
Summary
Detail-oriented Data Analyst with expertise in SQL, Excel, Power BI, and Python, dedicated to translating complex datasets into clear, impactful insights. Skilled in data visualization, simplifying technical findings for diverse audiences, and uncovering hidden patterns beyond raw numbers. Adept at storytelling with data, crafting compelling narratives that drive informed decision-making. Experienced in designing interactive dashboards, conducting training sessions, and collaborating across teams to enhance data-driven strategies Passionate about delivering actionable insights that bridge the gap between data and decision-makers.
Experiences
Data Analysis Instructor
- Delivered comprehensive training on essential data analysis tools such as Python, SQL, Power BI, and Excel, equipping students with both theoretical knowledge and hands-on experience to tackle real-world data challenges effectively.
- Designed and implemented interactive instructional materials and projects that emphasized practical applications of data collection, cleaning, and visualization techniques, enhancing students' ability to analyze and interpret complex datasets.
- Provided personalized mentorship and feedback to students, guiding them in applying data science methodologies to solve industry[1] specific problems while developing assessments to evaluate their progress and mastery of course content.
- Taught key data analysis tools and techniques, including Python, statistics, SQL, Power BI, and Excel, to students in the diploma.
- Designed and delivered instructional materials for each module, ensuring a deep understanding of both theoretical concepts and practical applications.
- Guided students in building real-world projects, focusing on data collection, cleaning, and visualization to develop their skills.
- Provided one-on-one mentoring and support to students, helping them apply data science methods to solve real-world challenges.
- Developed assessment materials and graded assignments to track students' progress and mastery of the course content.
- Conducted quantitative data analysis for research projects at Collective Routes, utilizing Excel and Power BI.
- Analyzed research data to generate statistical reports and extract valuable insights.
- Designed interactive dashboards using Power BI to visually communicate research findings effectively.
- Provided training sessions on Power BI usage, empowering researchers to analyze and present data proficiently.
- Managed 19 social dataset projects utilizing Excel and Power BI to collect and analyze over 10,000 data points, resulting in accurate information indicators and forecasts.
- Established and oversaw the "Modern Egypt program," which launched databases for modern Egypt's social history.
- Led and trained a team of 3 members, increasing their technical capabilities and improving project efficiency by 15%.
- Conducted multiple workshops on advanced Excel skills, dataset building, and analysis, resulting in a 50% increase in participants' data analysis abilities. Junior Data Analyst and Researcher
- Analyzed 5 social dataset projects using Excel and Power BI with 95% accuracy, totaling 5,000 data points.
- Conducted exploratory studies and literature reviews to support project objectives.
- Authored and prepared 20+ technical, research, and evaluation papers and reports, achieving an average rating of 4.5 out of 5 from project stakeholders.
Technical Skills
- Python
- Tableau
- Data Analytics
- SQL
- Microsoft Excel
- Data Cleansing
- SQL Server (SSIS) (SSAS) (SSRS)
- Microsoft Power Query
- Data Visualisation
- Power BI & Dax Language
- Data Modeling
- Exploratory Data Analysis
Top Projects
Power Bi Sales Report
Power Bi, Power Query
This project presents an interactive Sales Dashboard built with Power BI to analyze sales performance across countries.
Forecasting Website Traffic - Case Study
Python, Pandas, Numpy, Matplotlib, seaborn, Statsmodels, Plotly
This project develops a time series forecasting model to predict website traffic for The Clever Programmer. com . The analysis covers visitor
data from June 2021 to June 2022, with the goal of understanding traffic patterns and building accurate predictions for future periods.
Diamond Price Analysis and Forecasting
Python, Pandas, Numpy, Matplotlib, seaborn, Scikit-learn, Plotly
This project focuses on analyzing diamond prices based on their characteristics (carat, cut, color, clarity, etc.) and building a predictive
model to estimate diamond prices.Airlines loyalty - PlacementDost Internship
Power Bi, Excel, Power Query
This project involved analyzing data related to customer behavior, flight activity, loyalty history, and calendar events for PlacementDost
Internship using Power BI and MS Excel. The objective was to derive actionable insights to optimize customer engagement, loyalty
programs, and revenue generation.
Craigslist Used Vehicles Dataset Analysis
Python, Jupyter notebook, Pandas, Numpy, Matplotlib, Seaborn
Dec 2024
Craigslist Used Vehicles project gathers used vehicle listings across the U.S. from Craigslist using a custom scraper, providing a dataset
updated with over 18 categories of information such as price, condition, manufacturer, and location, offering insights into the used vehicle
market.
Restaurant orders - PlacementDost Internship
My SQL
The project aimed to develop a comprehensive restaurant management system using MS SQL. The dataset provided consisted of menu
details and order details, which were utilized to create and populate tables within the SQL database. Various SQL queries and operations
were performed to retrieve, analyze, modify, and manage restaurant data effectively.
HR Employee Survey Responses - PlacementDost Internship
Excel, Power Query
The project aimed to analyze employee survey data using Microsoft Excel. The dataset included responses from employees across different
departments, with varying levels of agreement/disagreement on several statements. The goal was to import, clean, analyze, and visualize
the data to derive meaningful insights regarding employee satisfaction and areas for improvement within the organization.
Diabetes Prediction Model using Regression
Python, Regression, Jupyter Notebook
This project aims to develop a predictive model to determine whether a patient has diabetes based on certain diagnostic measurements.
The dataset used for this analysis is originally from the National Institute of Diabetes and Digestive and Kidney Diseases. The objective is to
diagnostically predict whether a patient has diabetes using various medical predictor variables.
Restoring Maji Ndogo's Water Access - ExploreAI Academy Data science
Program project
SQL, My SQL, Jupyter Notebook
This project addresses the water crisis in Maji Ndogo through comprehensive SQL analysis. Leveraging data-driven solutions, it aims to
understand water access issues, assess water quality, and propose strategies for improvement.
TMDB Movie Database - ExploreAI Academy Data science Program project
SQL, My SQL, Jupyter Notebook
This project centers around a movie datab
Courses & Certificates
Data Science program
The ALX Data Science Program is a rigorous, hands-on course that taught me strong data analysis and data science skills. I gained
proficiency in Python, SQL, and machine learning techniques such as regression and classification. I also developed expertise in data
visualization using Matplotlib and Seaborn, enabling me to turn complex datasets into actionable insights. I completed real-world projects
on data wrangling, cleaning, and statistical analysis during the program. I applied data science methodologies to solve business problems
and provide data-driven insights, enhancing my ability to analyze large datasets and present findings.
Data Visualization in Power BI
Currently mastering audience-centric Power BI visualizations for clear and relevant insights. Developing skills in emotional connection
through ongoing exploration of concise dashboard elements like bar charts and small multiples. Actively exploring and implementing
cognitive load reduction techniques in Power BI for enhanced data communication.
Data analysis professional track
Introduction to Python Programming. Introduction to Data Analysis using Anaconda and Python data analysis packages. Data Wrangling,
Clean data using Python and Pandas, and data visualization using Python.
Intro to Descriptive Statistics
Intro to Research Methods. Create and interpret histograms, bar charts, and frequency plots. Central Tendency, Variability, Standardizing,
Normal Distribution, Sampling Distributions.
Data analysis challenge track
Ask questions and answer them using data. Calculate key business metrics in financial analysis and interpret the values. Forecast financial
metrics using scenario analysis, Digital Freelancing and the used platforms "globally and in the Arab world", and build an identity to work
as a freelancer.
SQL for Data Science
Advanced SQL, including clauses, operators, functions, subqueries, joins, and data modification techniques. Data retrieval, analysis, and
manipulation with advanced techniques applied in a data science context.
Education
Faculty of Commerce and Business Administration, Helwan University
Bachelor's degree
الدورات